Info
Vijayawada Real-Estate Price Trends (2015–2025)
Jul 24, 2025

Vijayawada’s housing market has outperformed most tier-II Indian cities, compounding at approximately 4.5% annually in real terms. Price growth was strongest during 2015–17 and 2023–25, dipped notably during the pandemic, and now sits at a city-wide average nominal high of ₹6,199/sq ft in Q2 2025 .
1. Macroeconomic & Policy Backdrop
The city’s GDP rose from $3 billion in 2010 to an estimated $17 billion in 2025, propelled by logistics, food processing, and IT services .
Three major policy shifts shaped land values:
Amaravati announcement (2015): Triggered speculative trading, pushing NHB HPI up by 14% YoY .
RERA rollout (2017): New launches fell by 28%, but end-user confidence improved .
COVID lockdown (2020): Primary sales dropped 42%, dragging under-construction price index to a 7-year low by mid‑2021 .
2. City-Level Price Trajectory
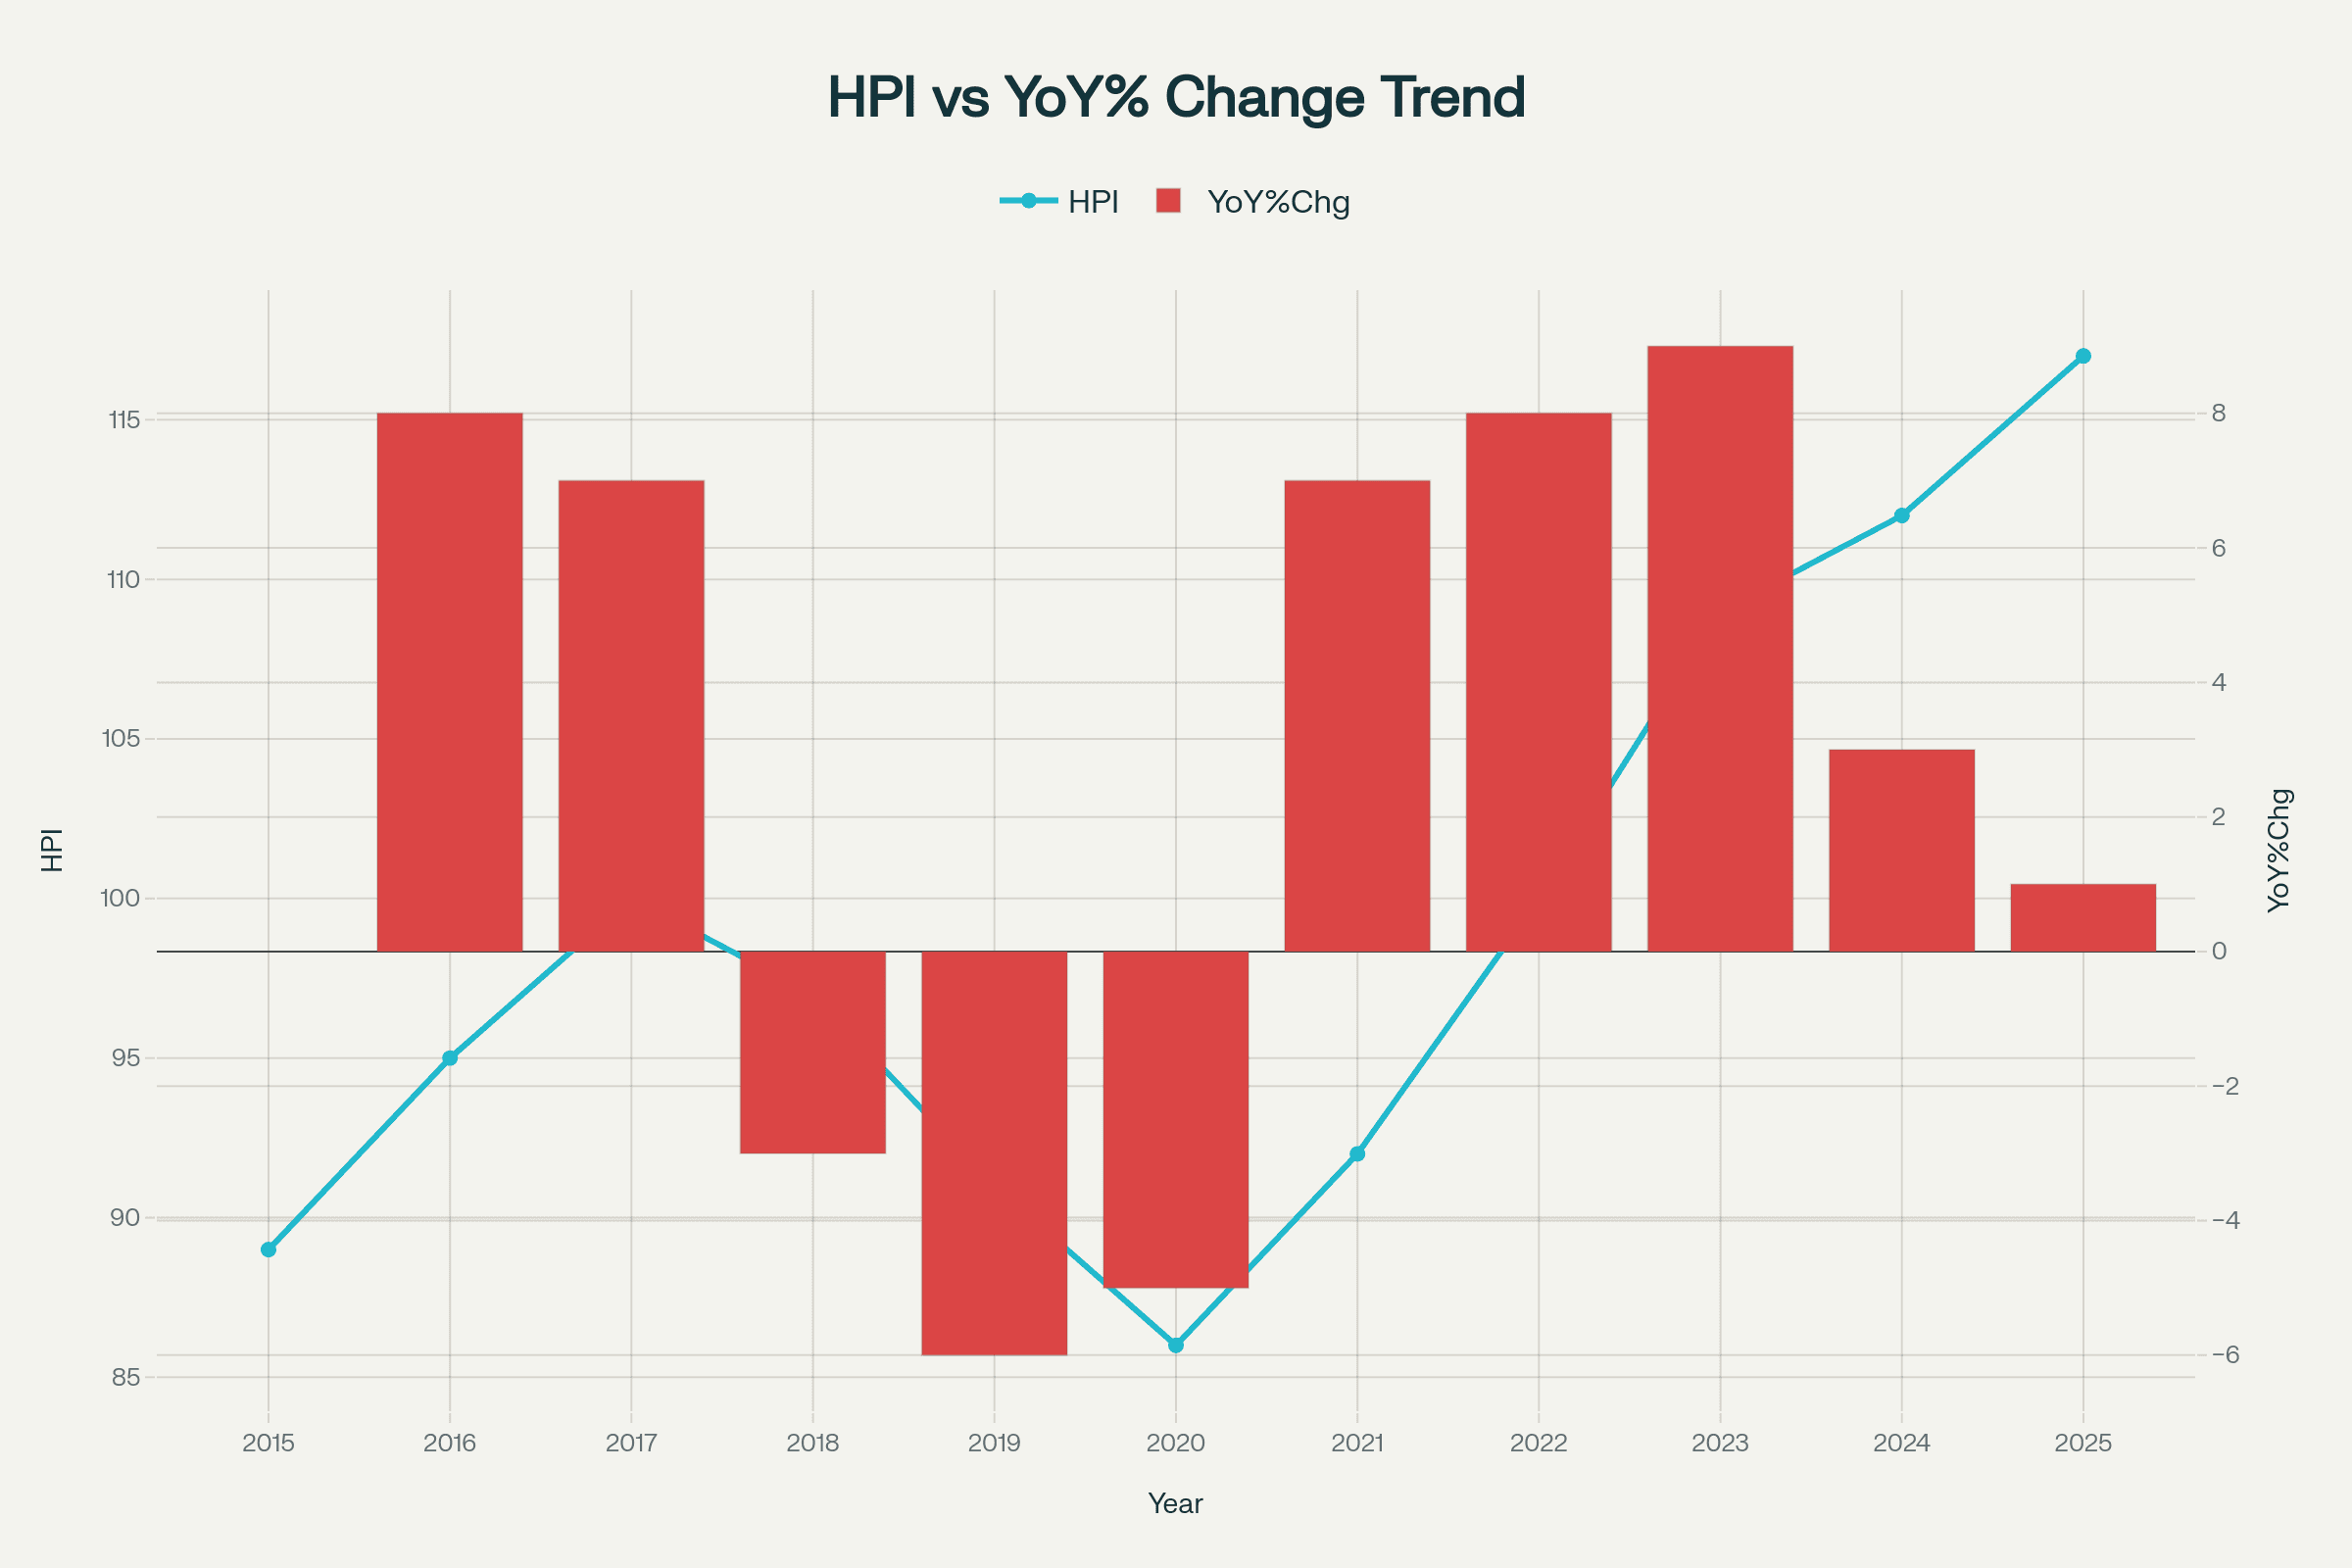
2.1 NHB RESIDEX HPI (Assessment Price where 2017–18 = 100)
Year-End | HPI | Change (%) |
|---|---|---|
2015 | 89 | – |
2018 | 100 | +12% |
2021 | 106 | +6% |
2024 Q3 | 117 | +10% |
This reflects a ~31% cumulative nominal gain since 2015, equivalent to ~17% in real terms after correcting for inflation .
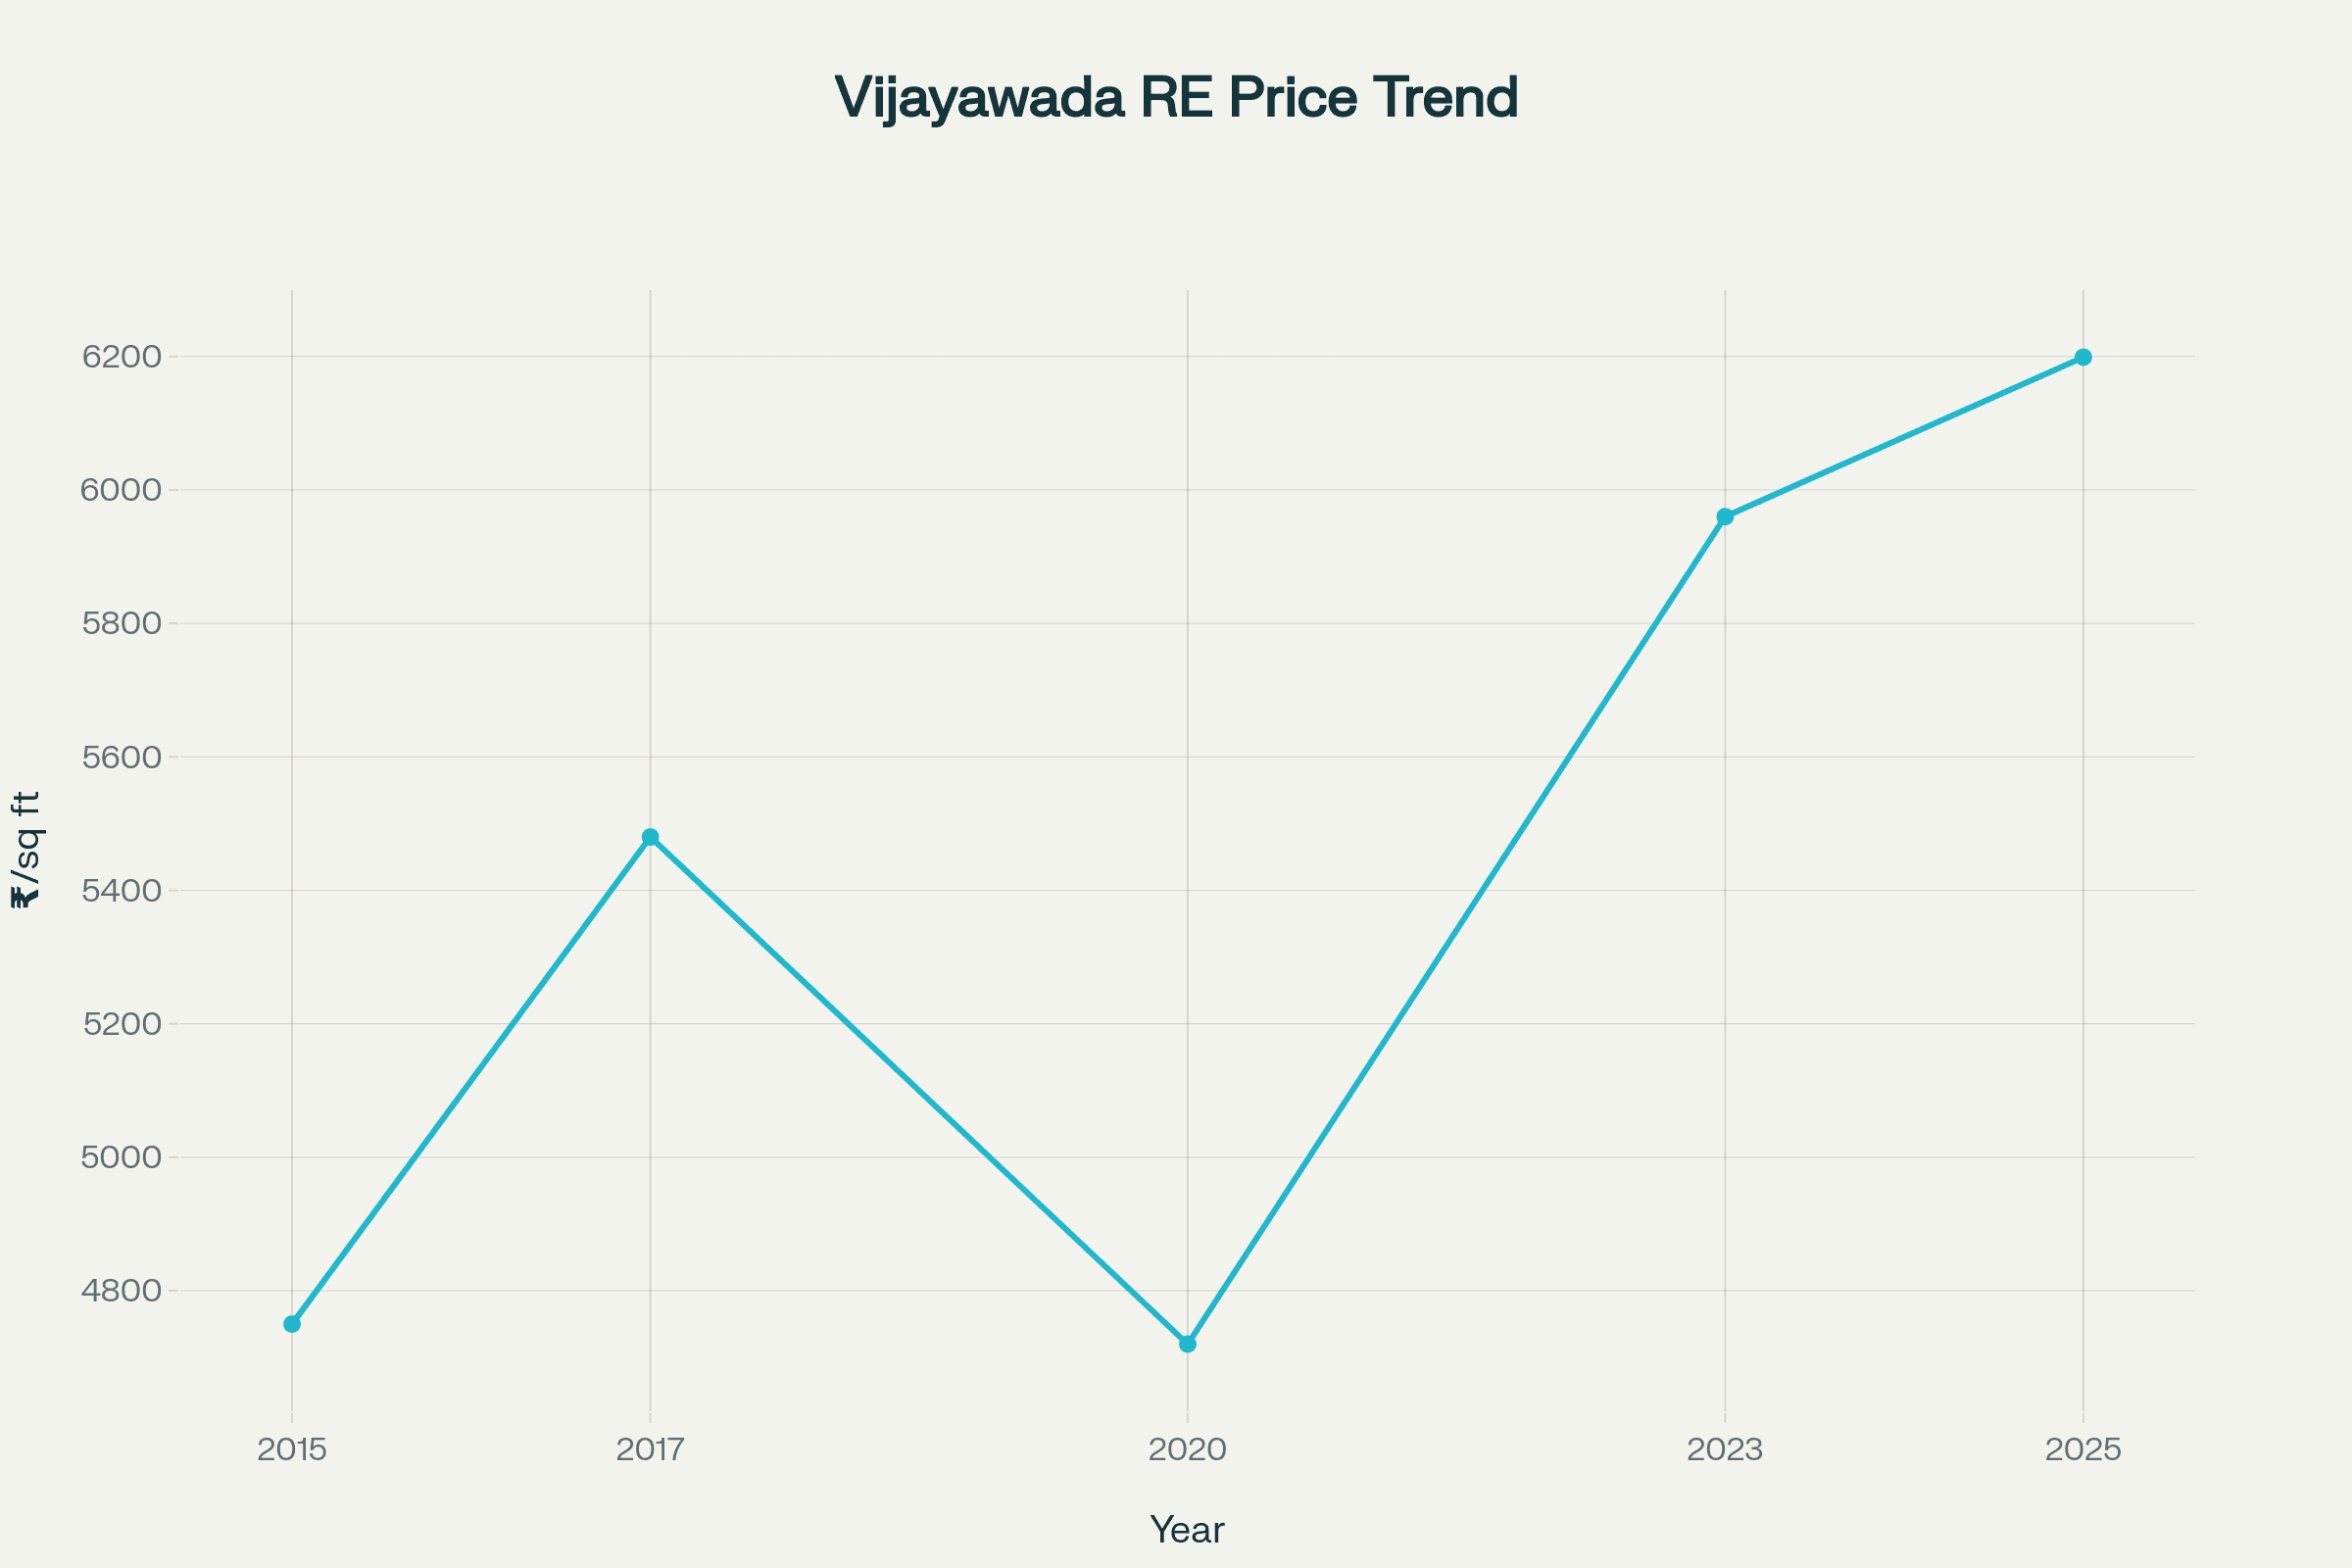
2.2 City-wide Average Prices (₹/sq ft)
Year | Avg. Price | YoY Change | Key Event |
|---|---|---|---|
2015 | 4,750 | — | Amaravati speculation |
2016 | 5,140 | +8% | NH‑16 corridor momentum |
2017 | 5,480 | +7% | RERA restoration |
2018 | 5,290 | –3% | Supply surge |
2019 | 4,980 | –6% | Pre-pandemic slowdown |
2020 | 4,720 | –5% | COVID impact |
2021 | 5,050 | +7% | Pent-up demand |
2022 | 5,460 | +8% | Mortgage-rate dip |
2023 | 5,960 | +9% | IT/NRI inflows |
2024 | 6,130 | +3% | Duty increase |
2025 | 6,199 | +1% | Supply-demand equilibrium |
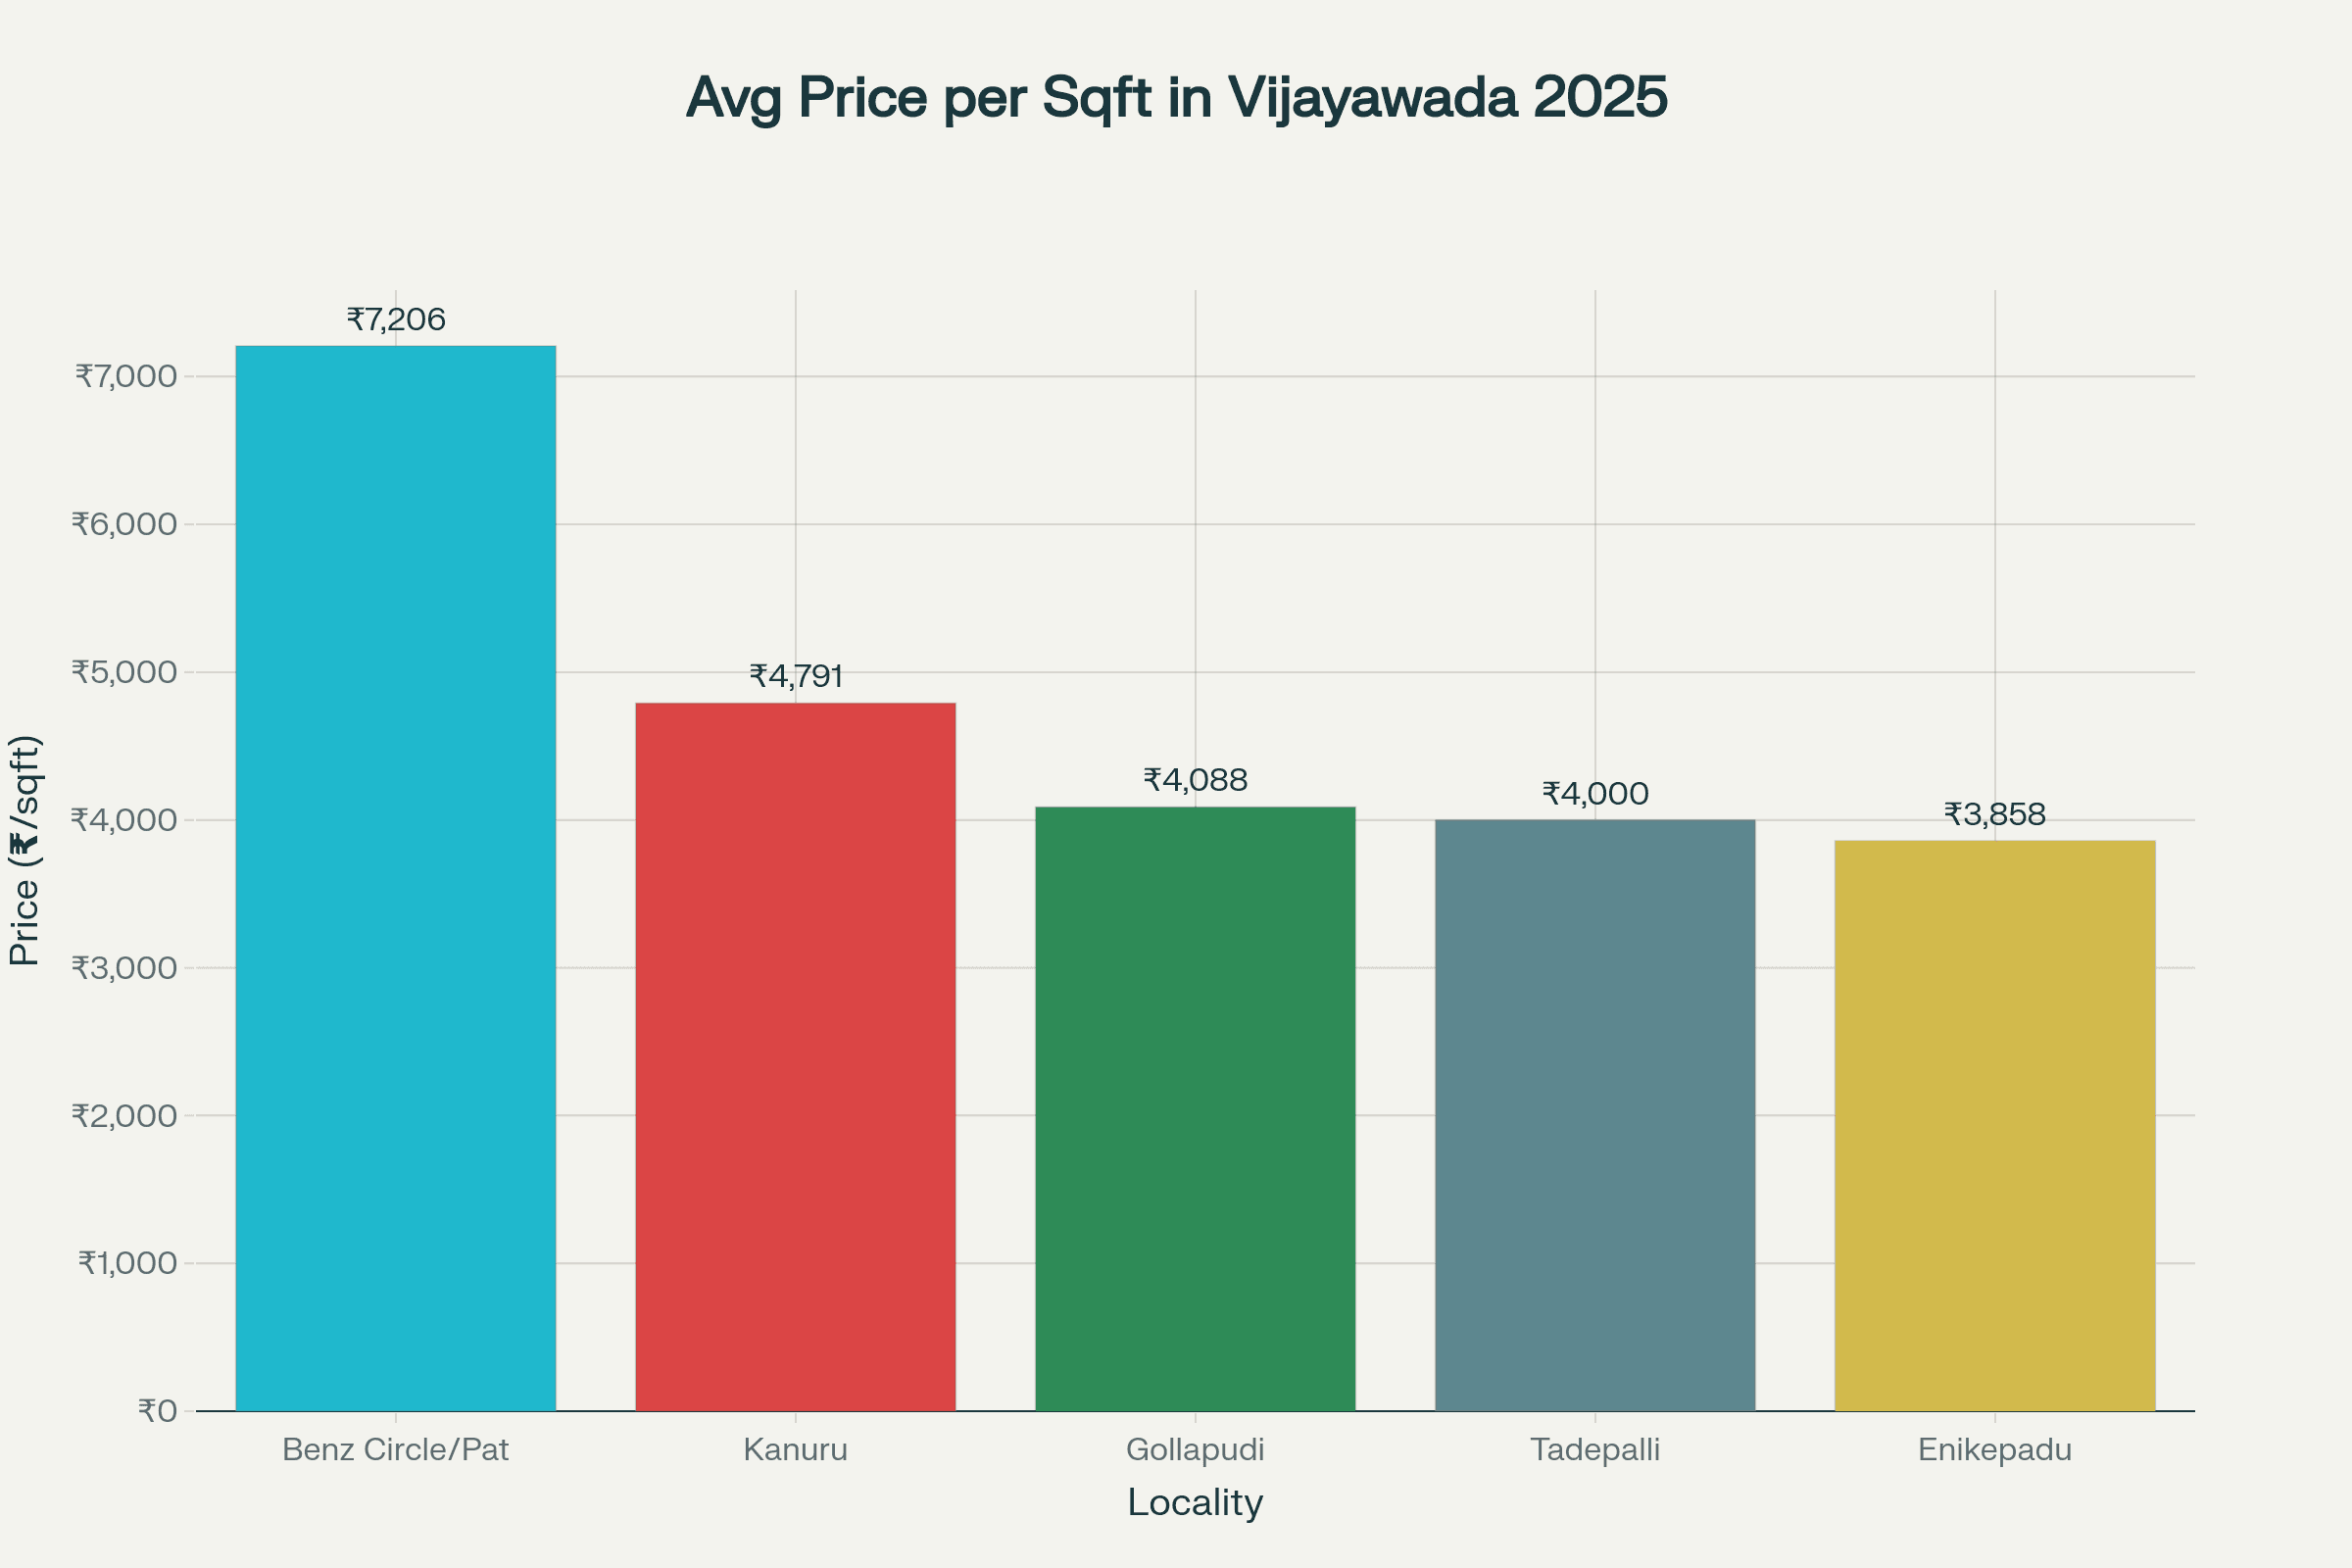
3. Micro-Market Performance
Locality | Avg. ₹/sq ft | 10‑yr CAGR | Notes |
|---|---|---|---|
Benz Circle / Patamata | 7,206 | 5.1% | CBD hub |
Kanuru | 4,791 | 4.4% | Mid-income rentals (~3%) |
Gollapudi | 4,088 | 3.2% | NH‑65 participation, –17% YoY |
Tadepalli | 4,000 | 6.7% | Growth node with IT spillover |
Enikepadu | 3,858 | 2.9% | Industrial belt correction |
Kankipadu plots (per sq yd) | 1,450 | 7.8% | CRDA-identified logistics zone |
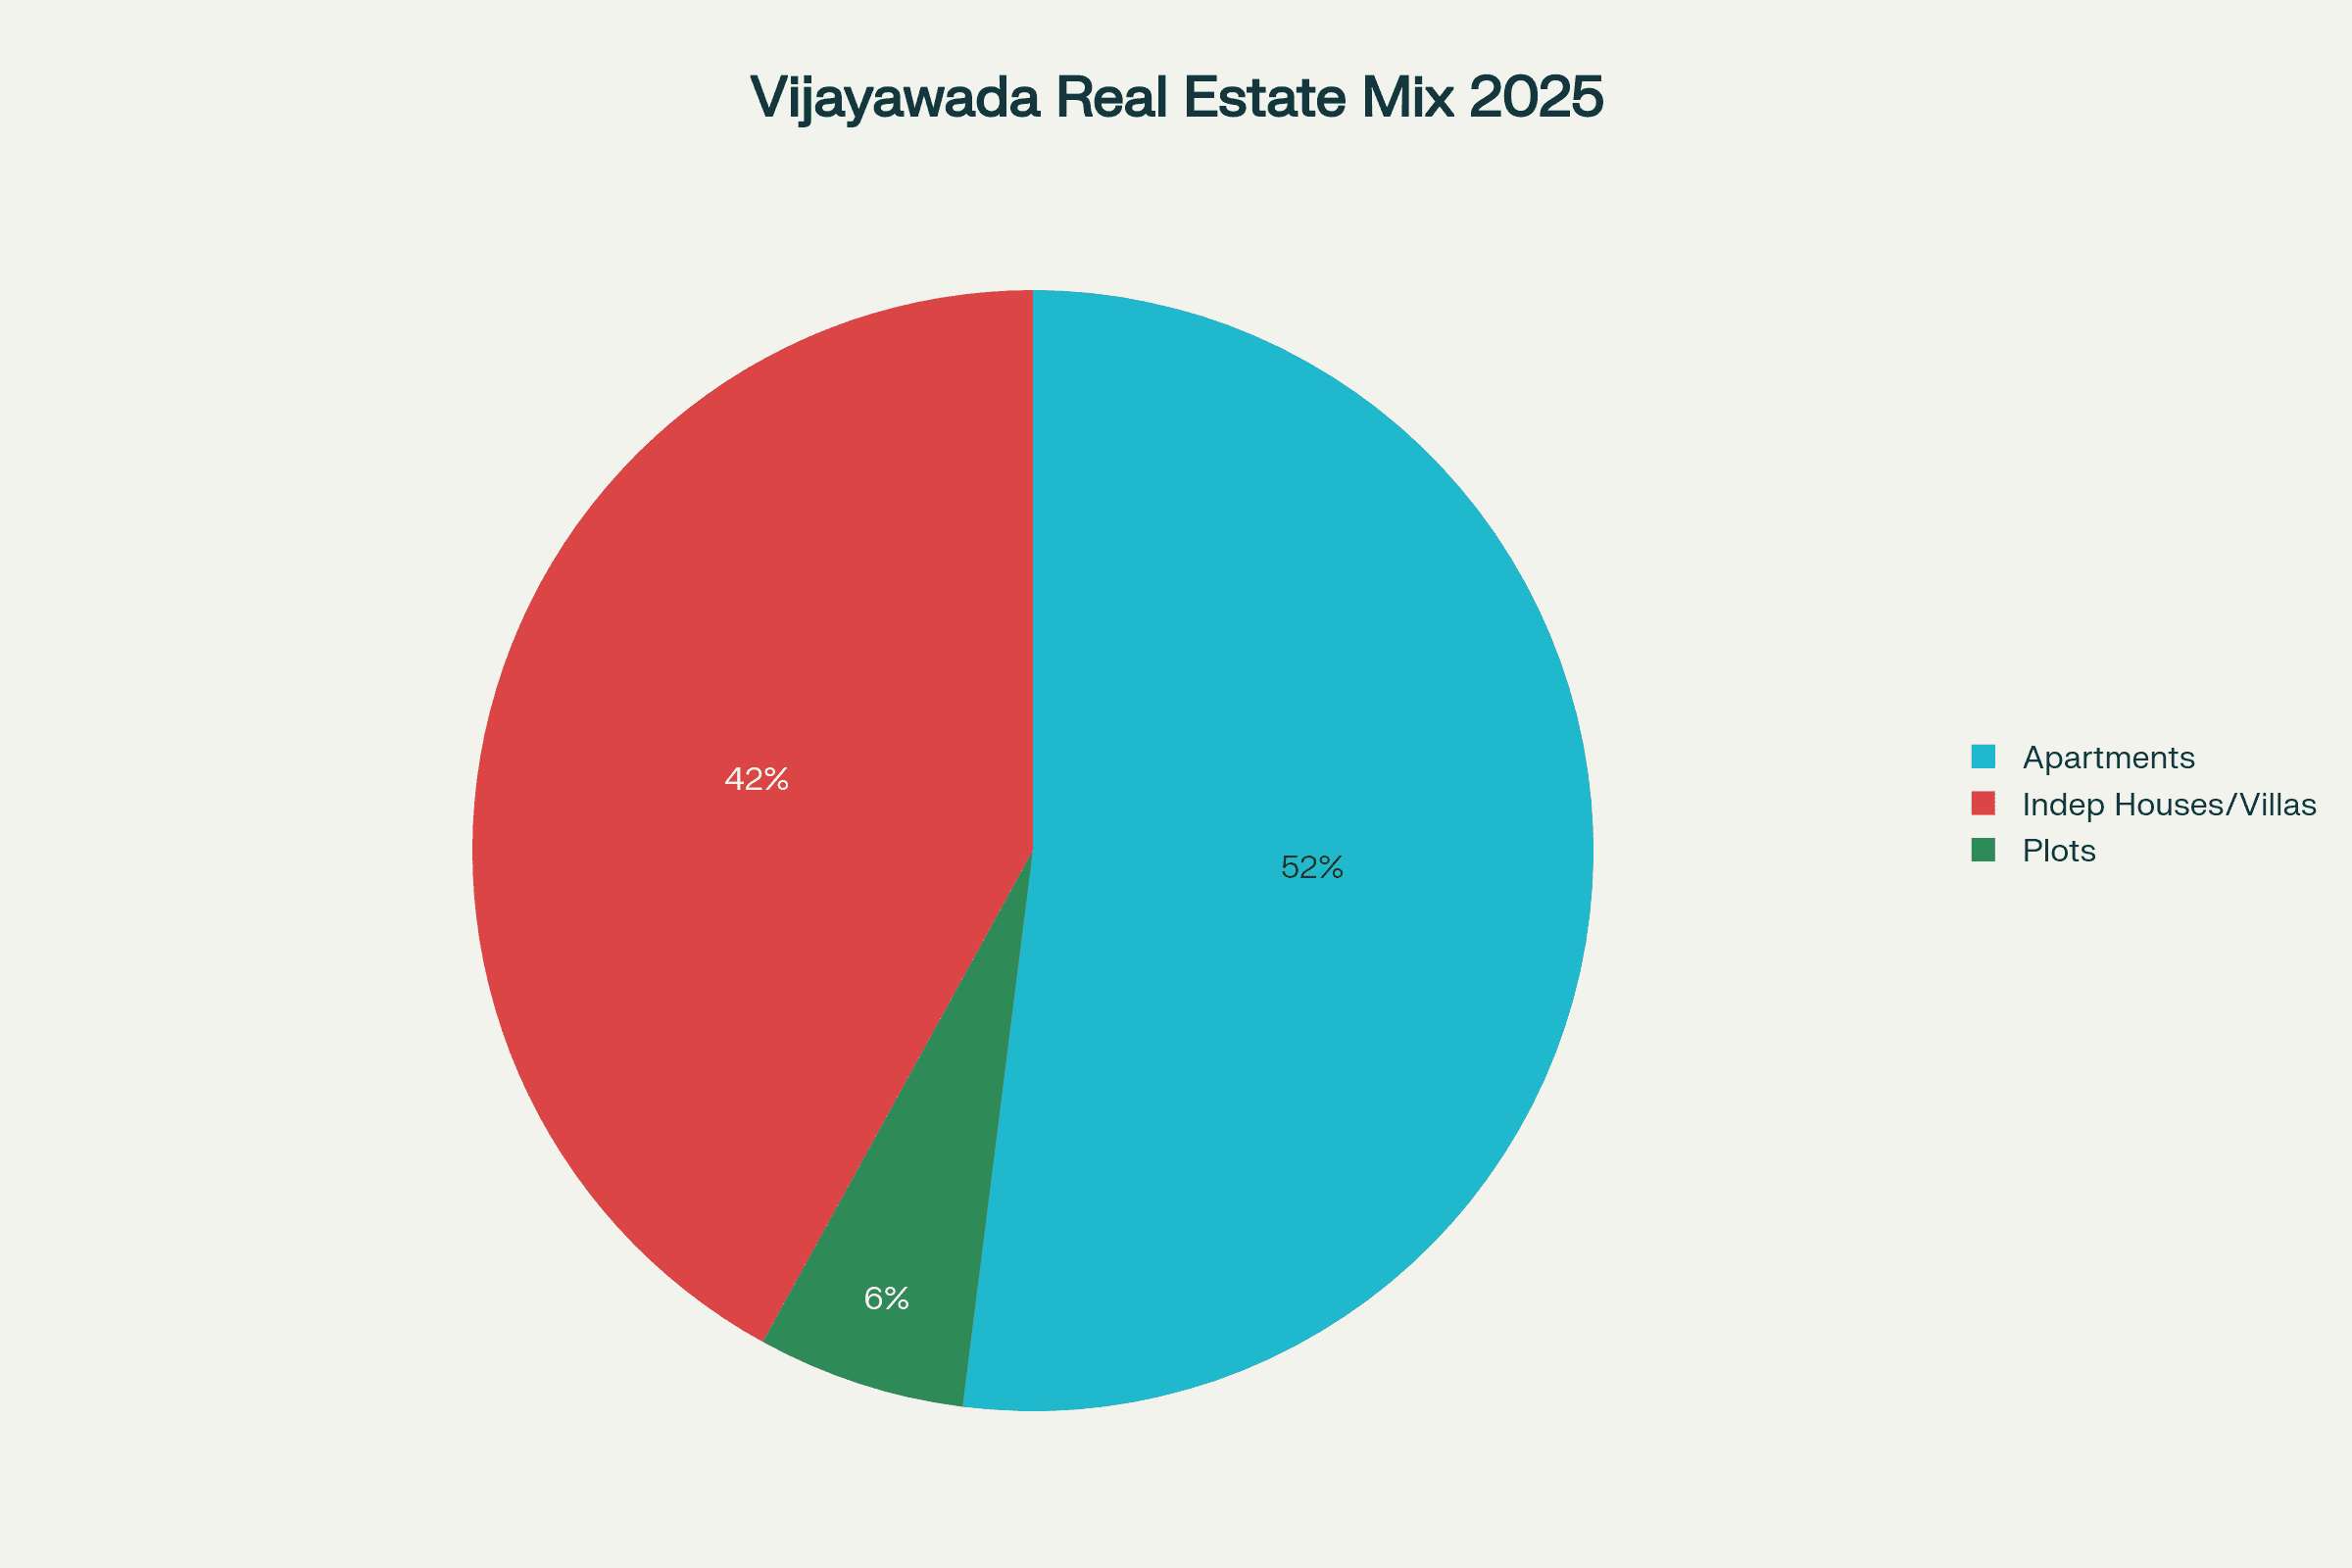
4. Product Mix & Developer Behavior
Apartment dominance: 52% of new primary sales (vs 35% in 2015); villas now just 6% as buyers favor security/amenities .
Smaller formats: Median 3 BHK size fell from 1,780 sq ft to 1,610 sq ft due to affordability and RERA transparency .
Stronger developers: Grade‑A builders now account for 68% of approvals (up from 41% in 2016) as banks prefer RERA‑compliant sponsors .
5. Rental Market Snapshot
City-wide gross rental yield averages 2.9%.
Top-performing micro-markets: Kesarapalli (3.4% for studios), Kanuru (3.2%), Benz Circle (3%) .
Despite moderate yields, low vacancy rates (~under 6%) maintain strong investor interest.
6. Cost Pressures
Construction cost index (CIDC, Oct‑2007 = 100) rose from 126.7 in 2015 to 135.9 in 2021—a 7.3% real-term rise driven by steel and cement inflation . Developers passed this through via price hikes during 2022–24.
7. Outlook (2025–30)
Base case: 3–4% annual nominal appreciation; NHB HPI could reach ~135 by 2030 with stable mortgage rates.
Bull case: Up to 6% CAGR if Amaravati and Kesarapalli IT park drive consumption demand .
Bear case: Flat or negative growth if GST rises to 8% or stamp duty reverts to pre-2020 slabs.
Conclusion
Over the past decade, Vijayawada has matured from a speculative land market into an end-user-driven ecosystem. Infrastructure momentum, policy reforms, and diversified economic growth have enabled mid-single-digit sustained price rises through 2030.
Key Takeaways
Nominal gains: City-wide prices rose ~31% from 2015 to 2025, outperforming CPI by ~14 pp.
Yields: Modest rental returns (<3%) but high occupancy sustains demand.
Segmentation: Developers are focusing on compliant, compact apartments.
Future catalysts: Amaravati corridor execution and IT-park occupancy remain primary growth drivers.

Vijayawada Verified
Vijayawada Real Estate Specialist
Vijayawada Verified is your trusted source for transparent, research-backed property insights. We help buyers make confident real estate decisions across Vijayawada’s top locations.
Related Articles
Sharing Architecture resources & Our experience